Search visualization lets you explore documents in your database to identify trends, patterns, and aggregate metadata.
Accessing search visualization
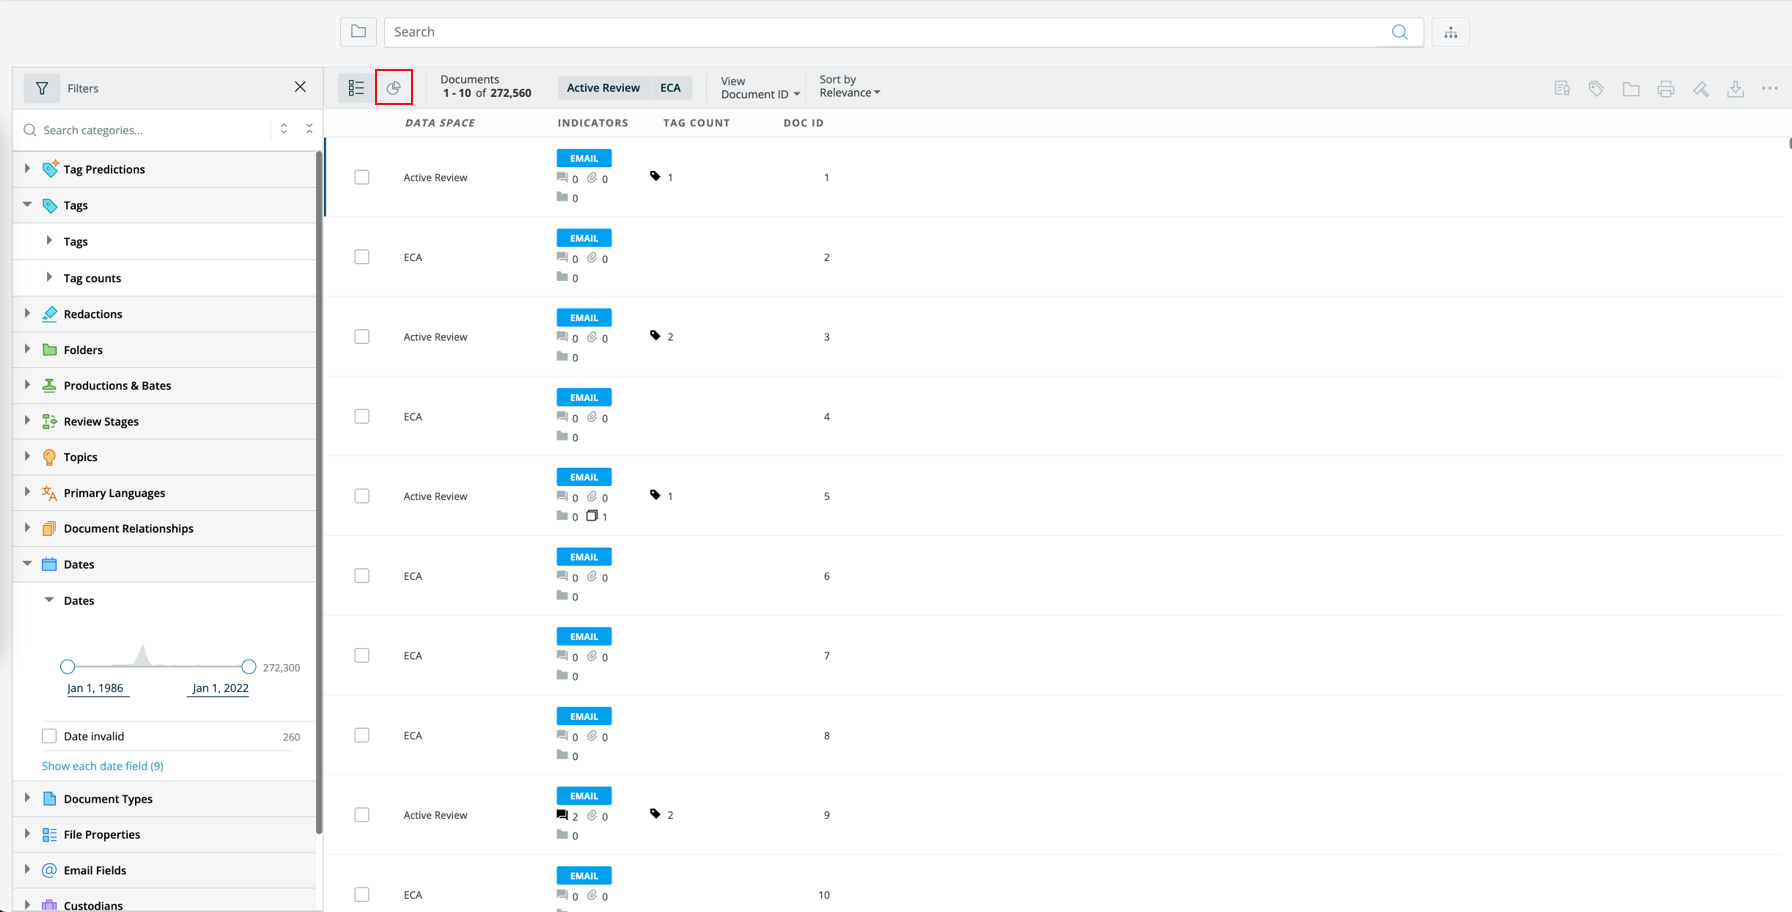
Click the pie chart icon in the search results toolbar.
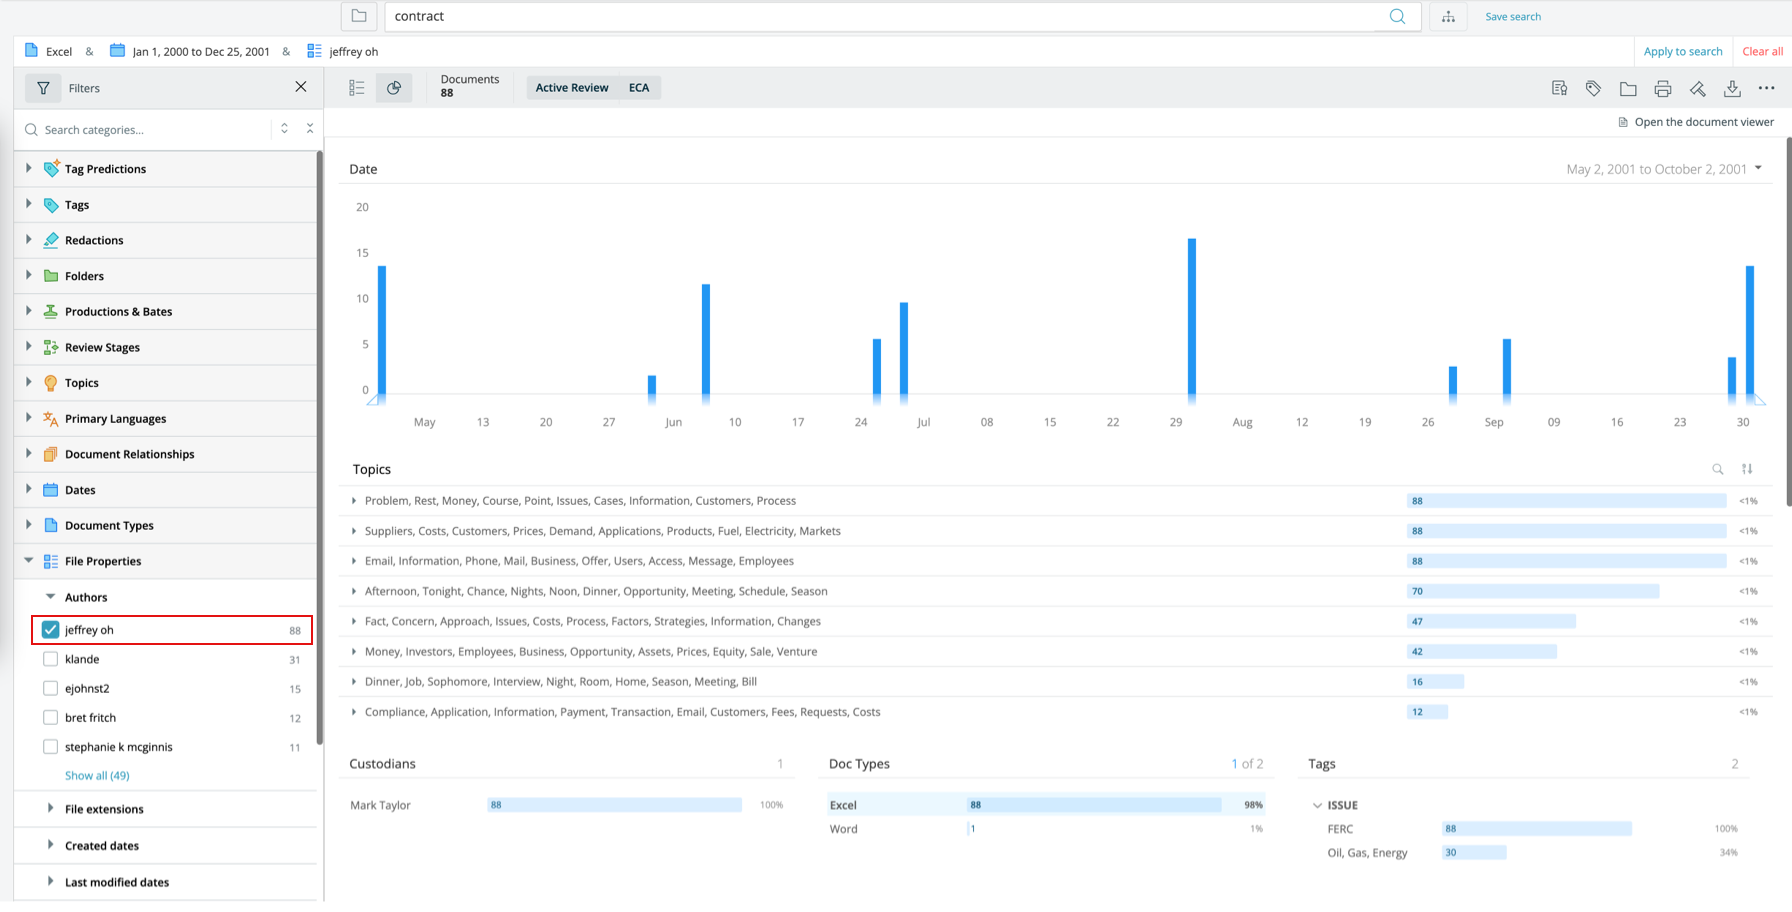
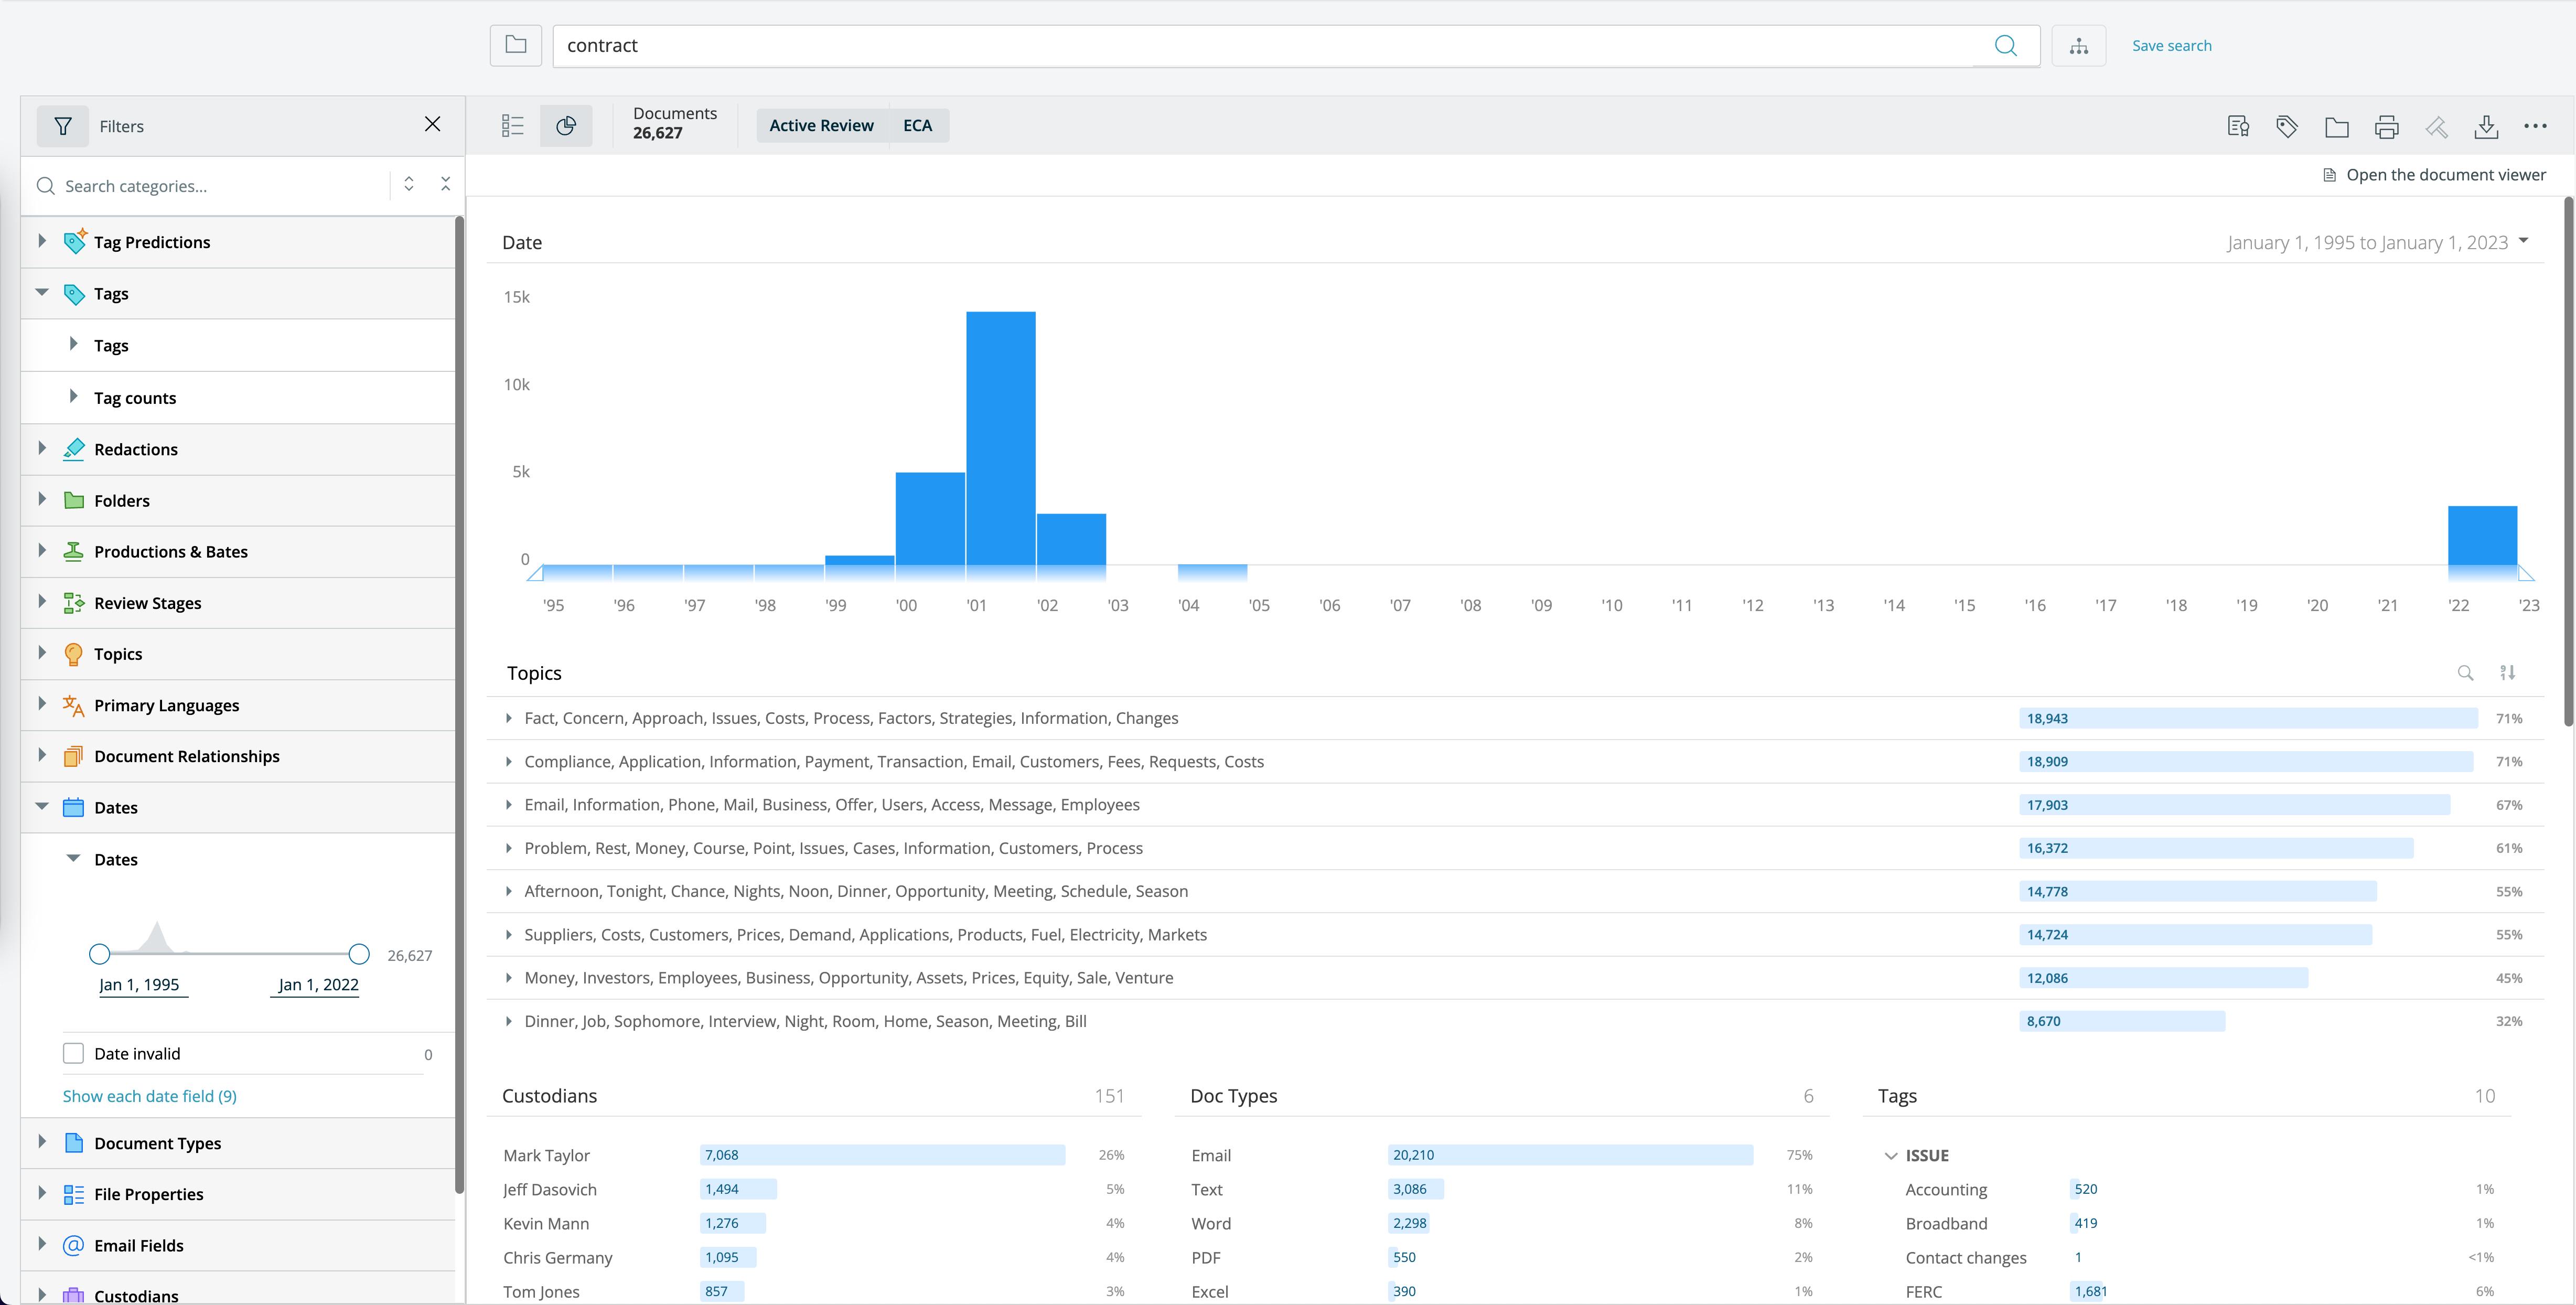
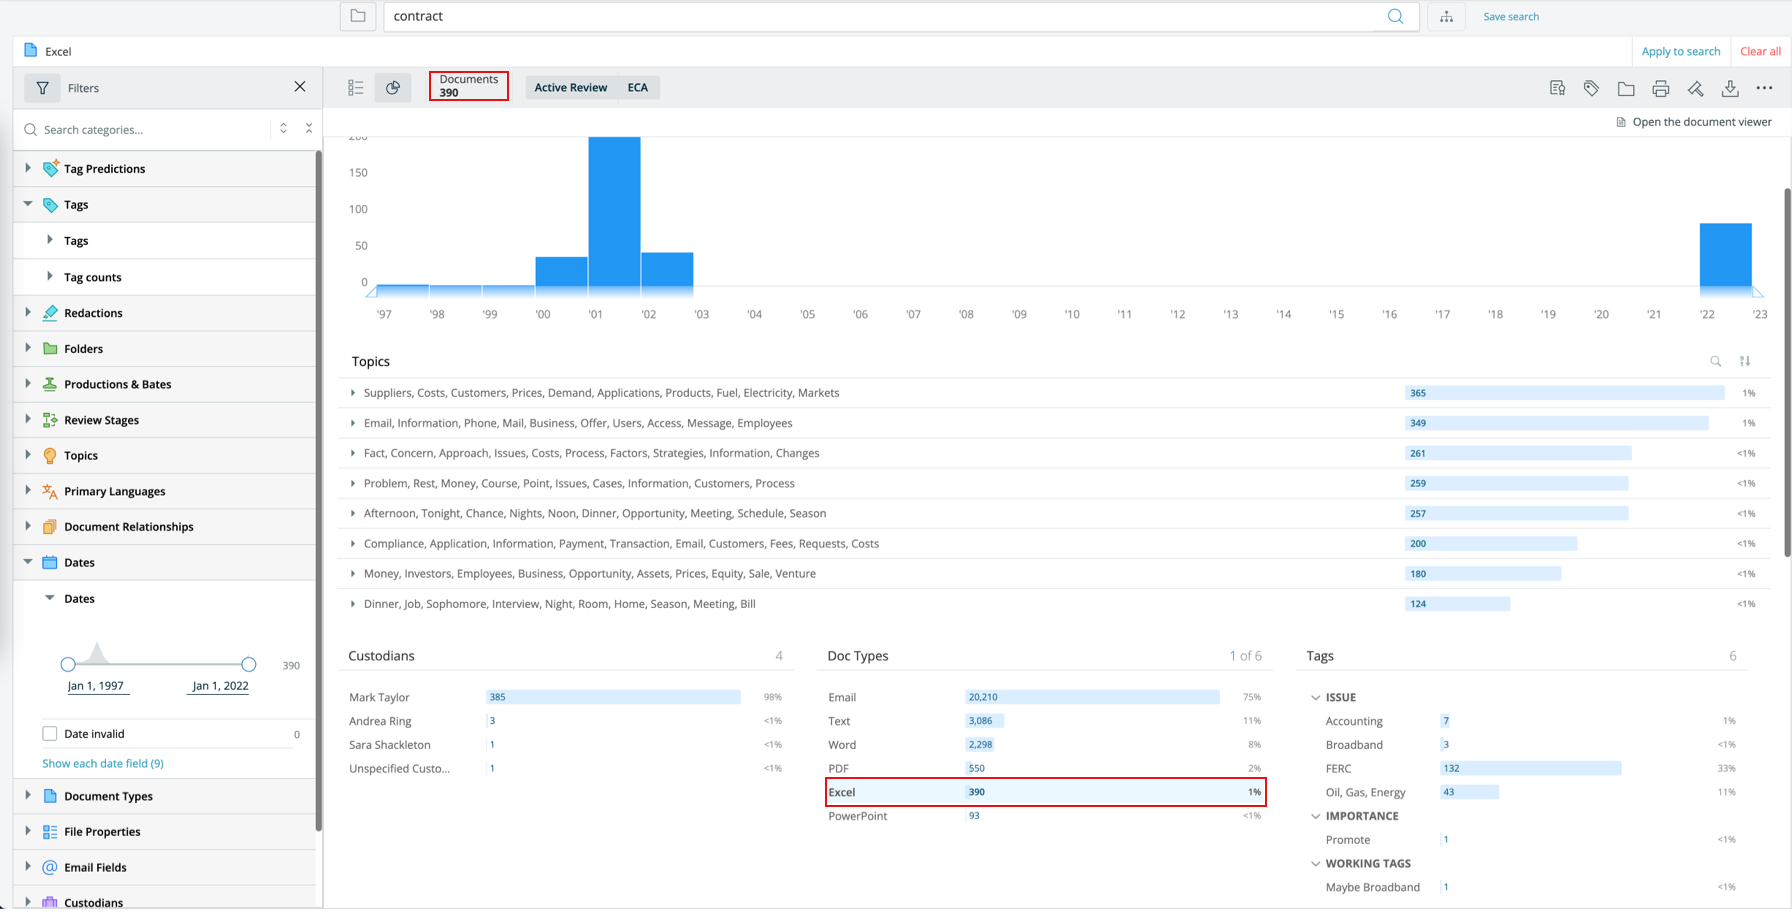
Based on your search query, the system visually displays various metadata facets.
Sorting and drilling down
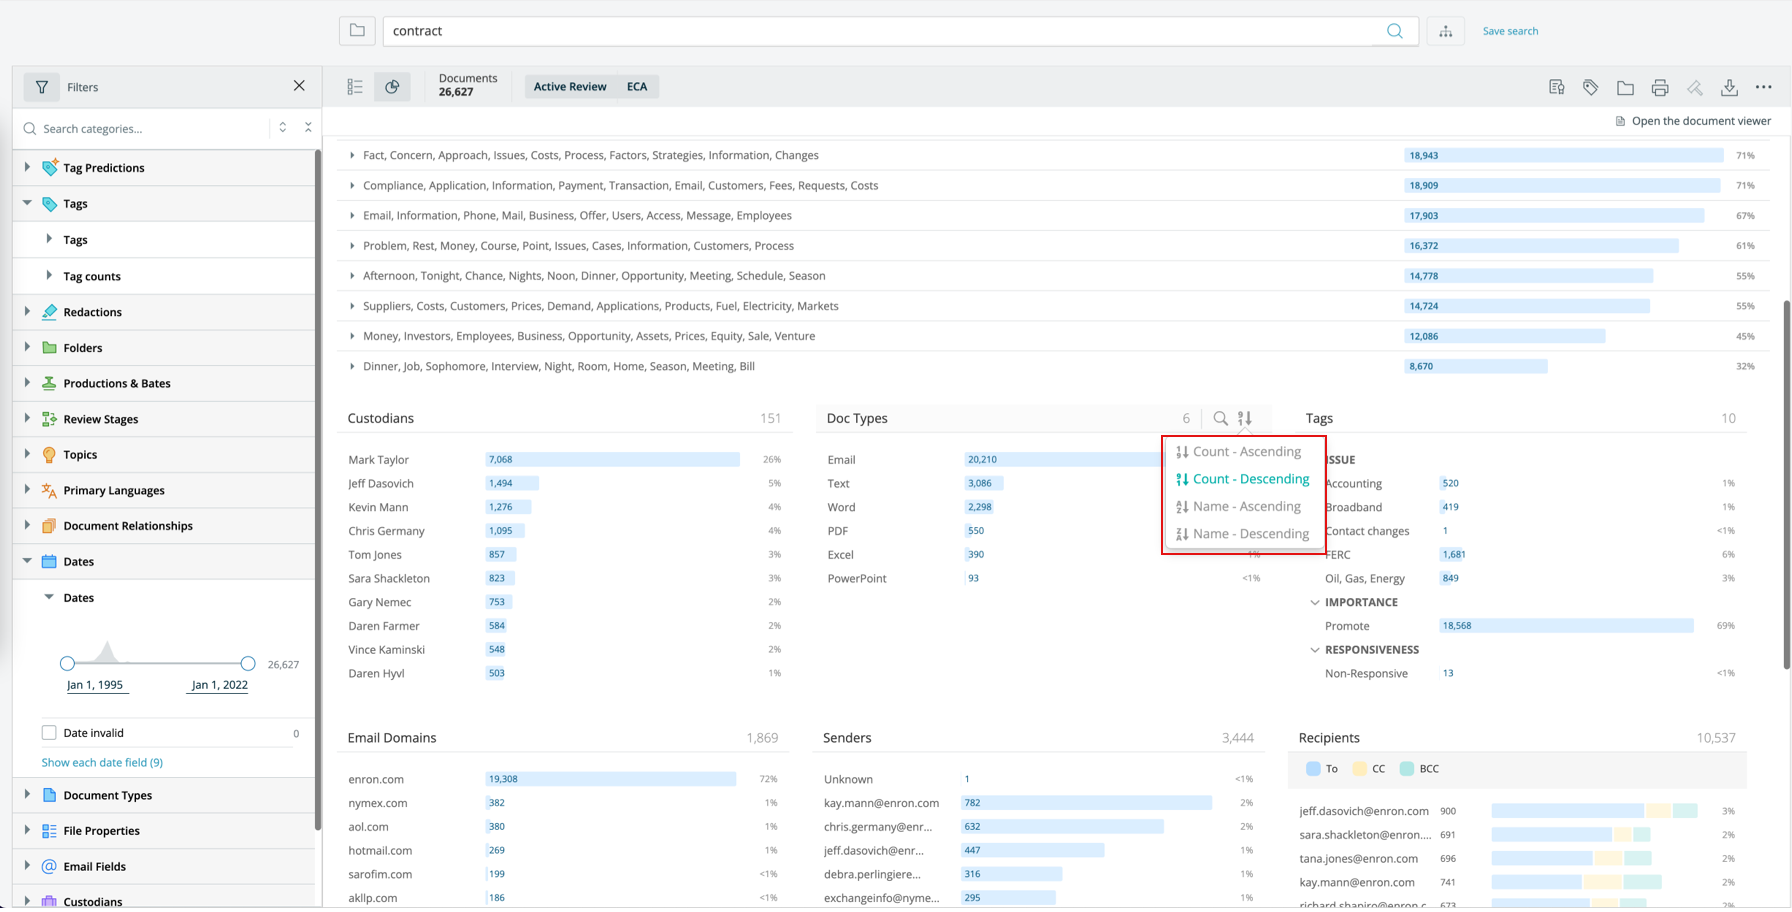
Hover over the document count field to access sort options.
Click any metadata item to drill down into the search results. For example, clicking Excel narrows the results and metadata to only Excel documents.
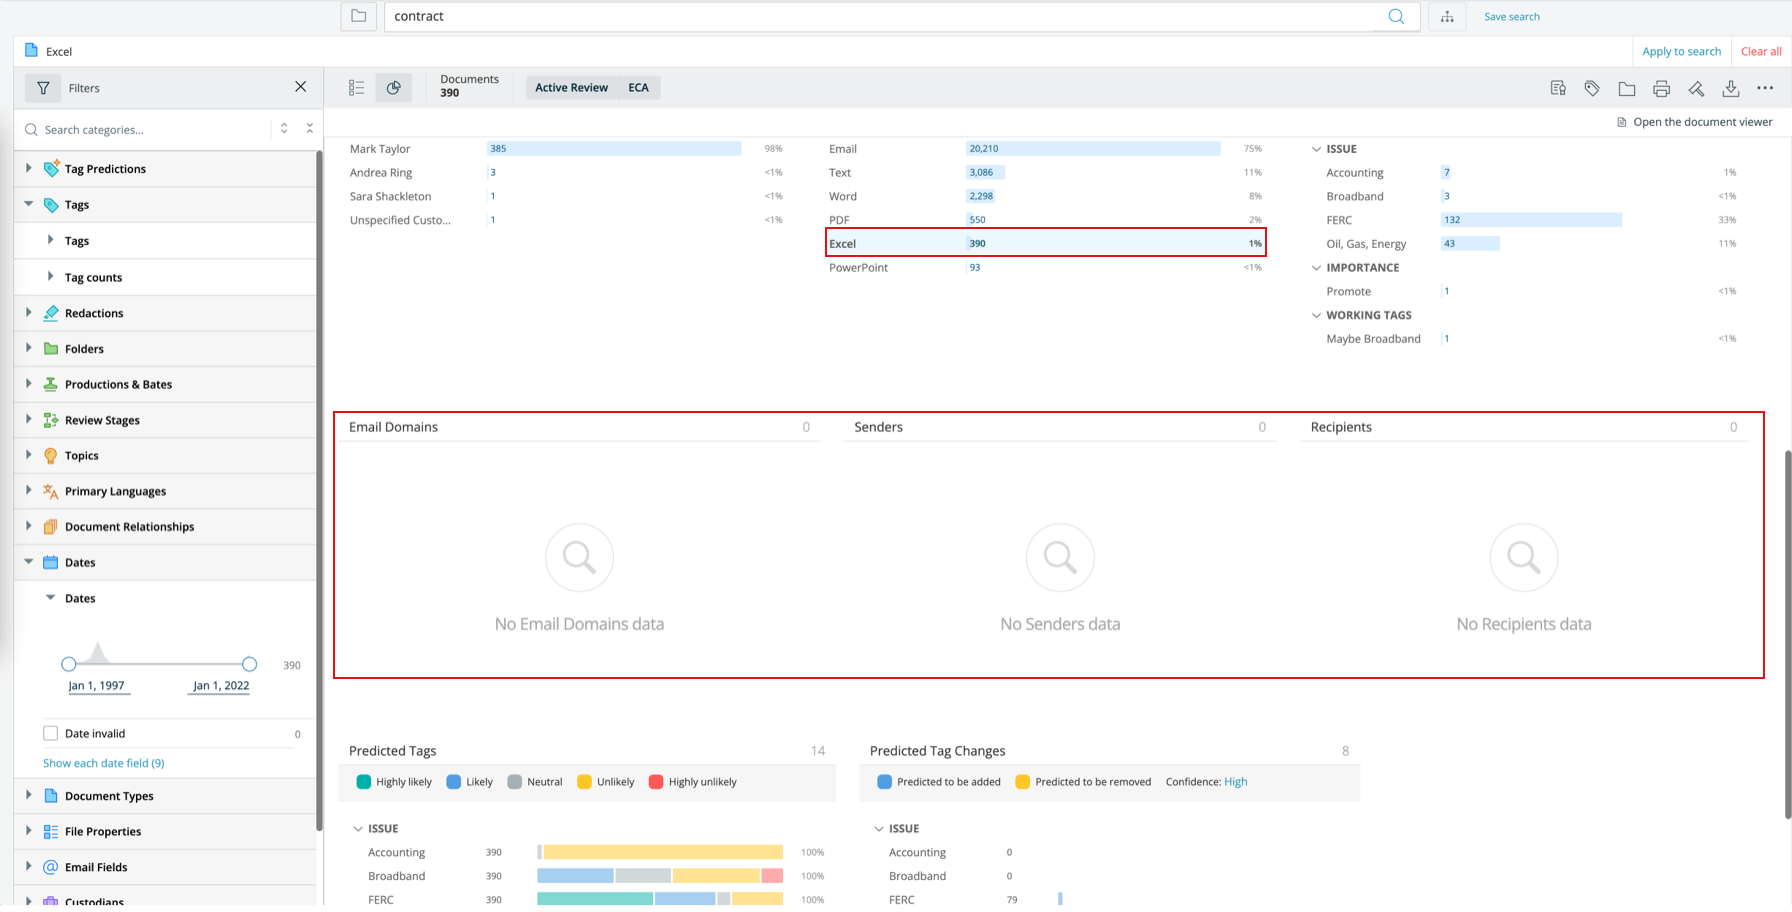
As you click metadata, other fields adjust based on your selection. For example, if Email is not selected, fields such as Email Domains, Senders, and Recipients show no documents.
Date sliders and saving searches
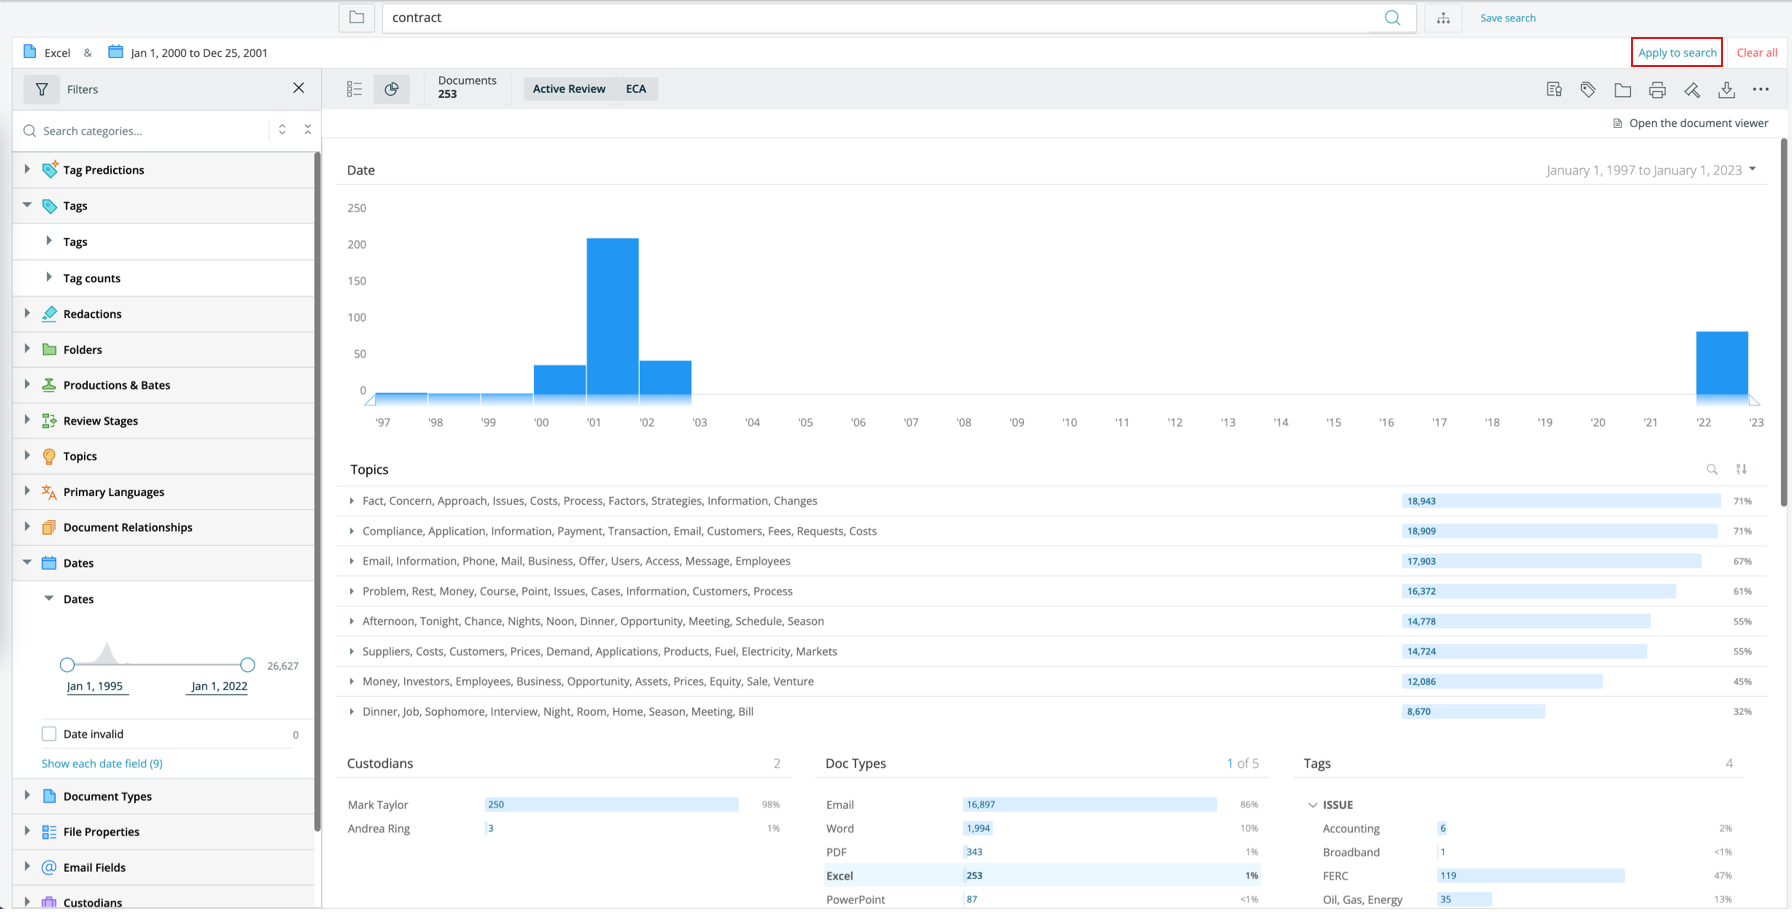
Use the date sliders to narrow the date range. Click Apply to search to update the chart. The metadata you selected becomes part of your search history and can be saved.
Using search filters
Search filters can further narrow your results within the visualization.